Education
...Pick one.
Why Does This Section Exist?
I am a very curious person. And since I have always been very interested in science I thought it’s a good idea to share some of it.
Often it seems to me that the creators of great astrophotography images are solely interested in making the picture than knowing what you can see on them. Not me! I want to know, what it is that I am seeing and maybe – if possible – also to know how it was created, which processed occurred and how scientist analyze those processes. – Please pick one topic below you’re interested in and see what you can learn.
I try to learn this stuff myself so I NOT just copy-an-paste Wikipedia® articles. – Since I am a scientist myself I also know how to do literature research. And if possible I learn from scientific papers, review etc.
Disclaimer: The sections of this chapter are intended as a short overview with basic informations. You can find detailed informations in the internet. I try my best to only include scientific facts. But mistakes happen. – If you see one please write me a message using my contact form.)
Astrophotography gear-related
Astronomy / Astrophysics
Light Pollution Index (Bortle Scale)
The term light pollution describes a phenomenon in industrialized countries, cities, locations etc. with high distribution of light-emitting devices like traffic lights, citiy lights, cars etc. in the human visual range. Mostly white and yellow light. This leads to outshine of visible stars and other objects in the night sky due to strongly reduced contrast.
But it has also dramatic effects on animals, plants and humans. Some animals for example show a shifted night-day rhythm which is often lethal for specific species. (Fig. 1).
The Bortle scale (named after the american amateur astronomer John E. Bortle) is a nine-level numeric scale that gives an idea about the local light pollution. Ranging from 1 – low light pollution with very good seeing condition – to 9 – severe light pollution with strongly reduced night sky and star seeing due to low contrast.
The Scale was first published by Bortle in Sky and Telescope magazine in 2001.
In contrast to seeing scales the Bortle scale is predominately not based on artificial optical tools.
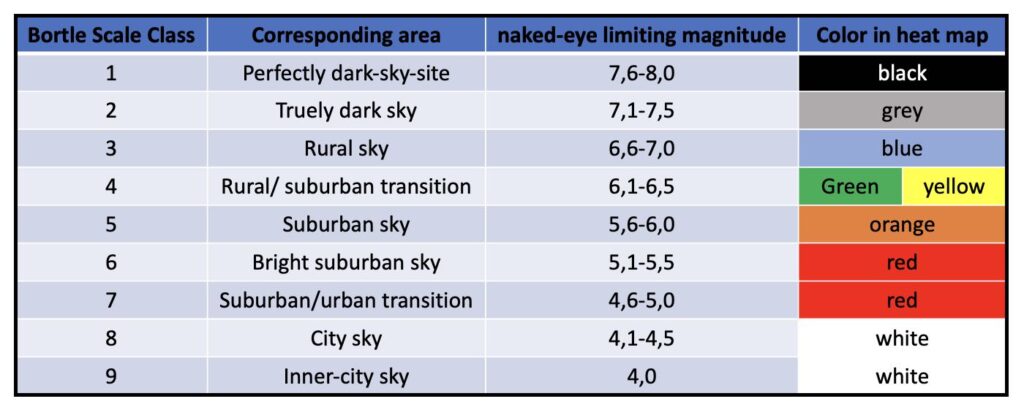
In Fig. 3 you can see Bortle scale indices of the corresponding areas.
BUT it’s also important to note that the Bortle scale is quite subjective. „Subjective estimates may not always be reliable or accurate“ (Human contrast threshold and astronomical visibility by Andrew Crumey, 2014)
). – It’s okay for a rough estimation of the local light pollution.
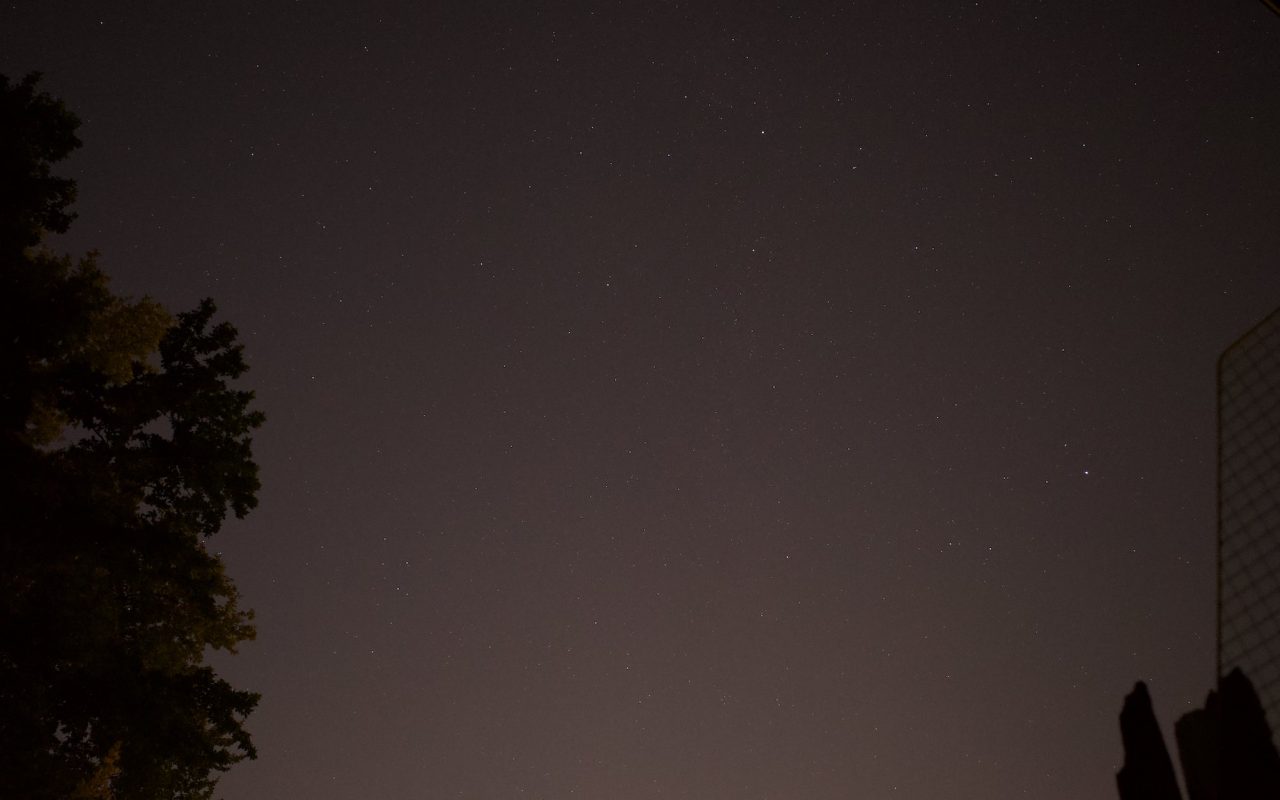
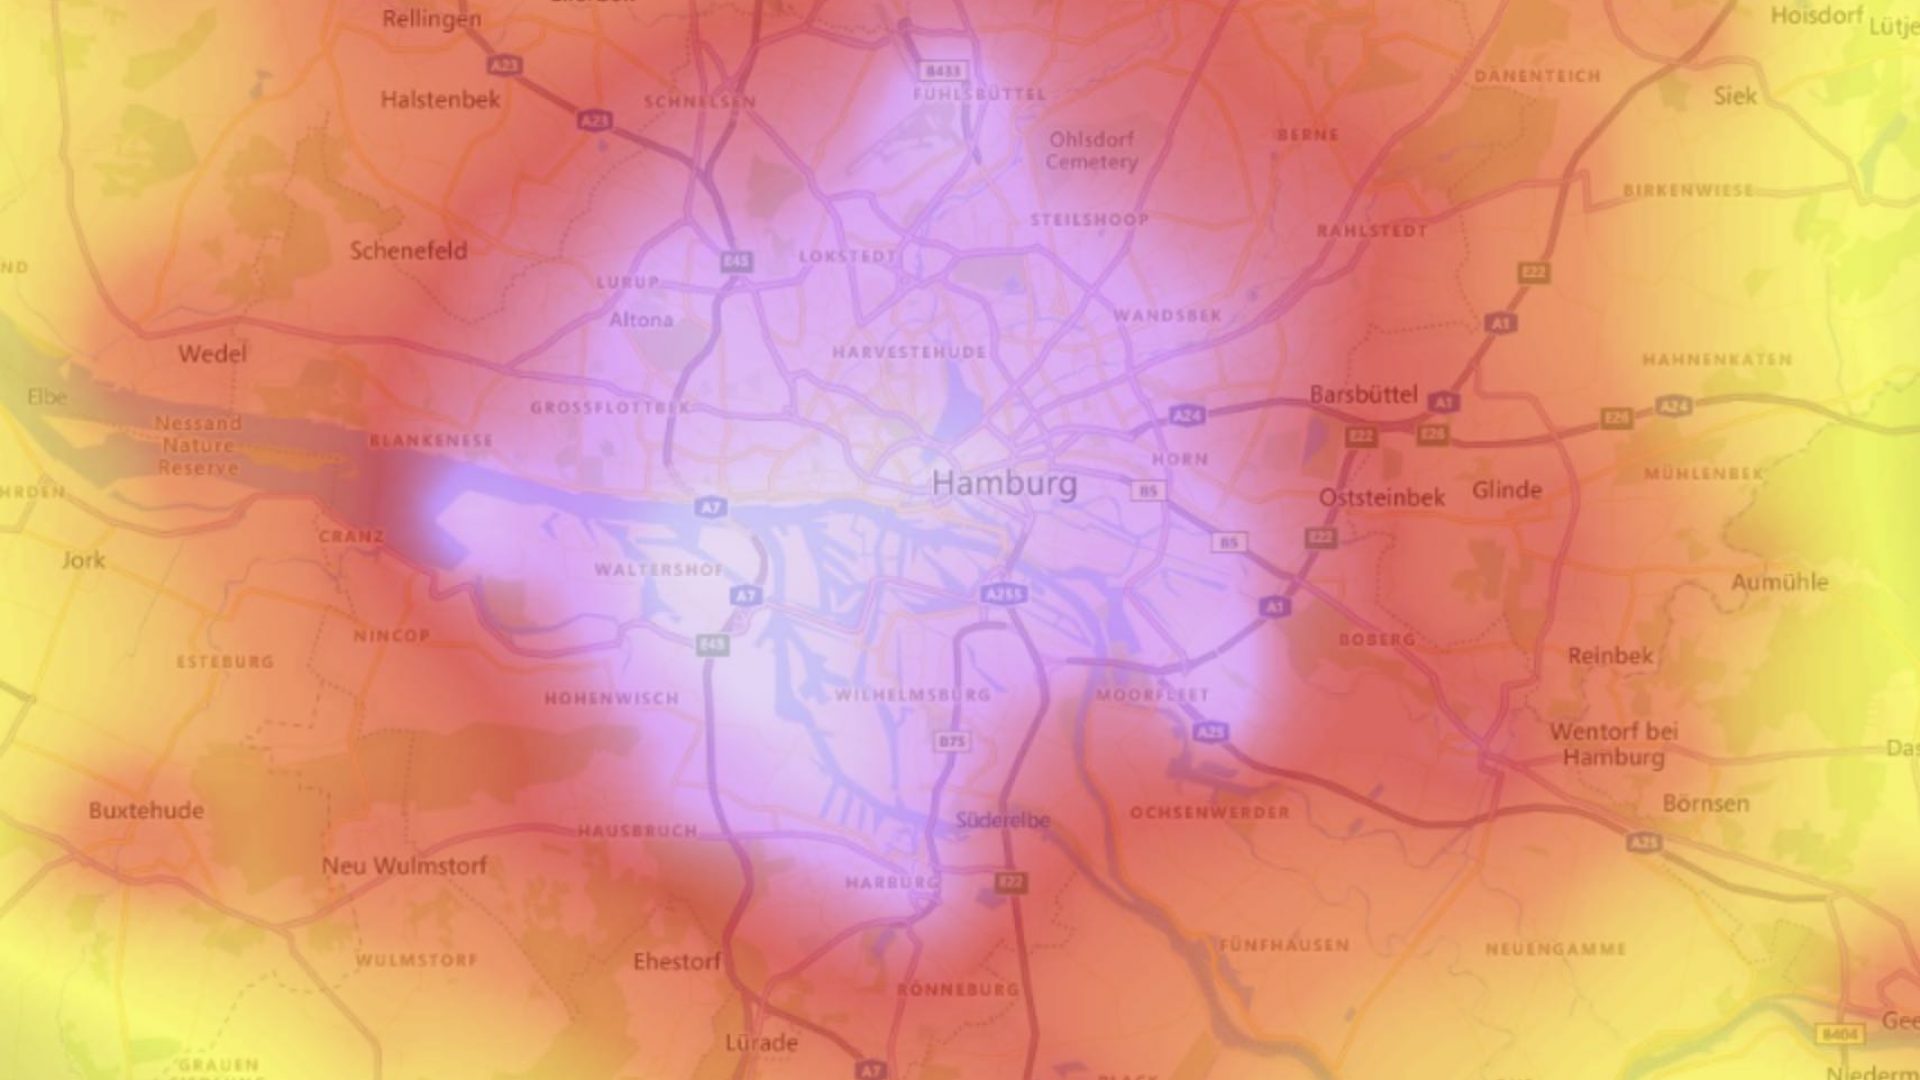
Therefore, cities and neighboring location show a high Bortle scale index of about 6-9. My current region is a 7-8 Bortle scale region (Fig. 2).
In contrast: The location of the Very Large Telescope (VLT) is practically not light light-polluted – Bortle scale 1 (Fig. 4.).
You can find informations of your regional light pollution in the internet.
Capturing the "Blue Moon" with a DSLR camera only
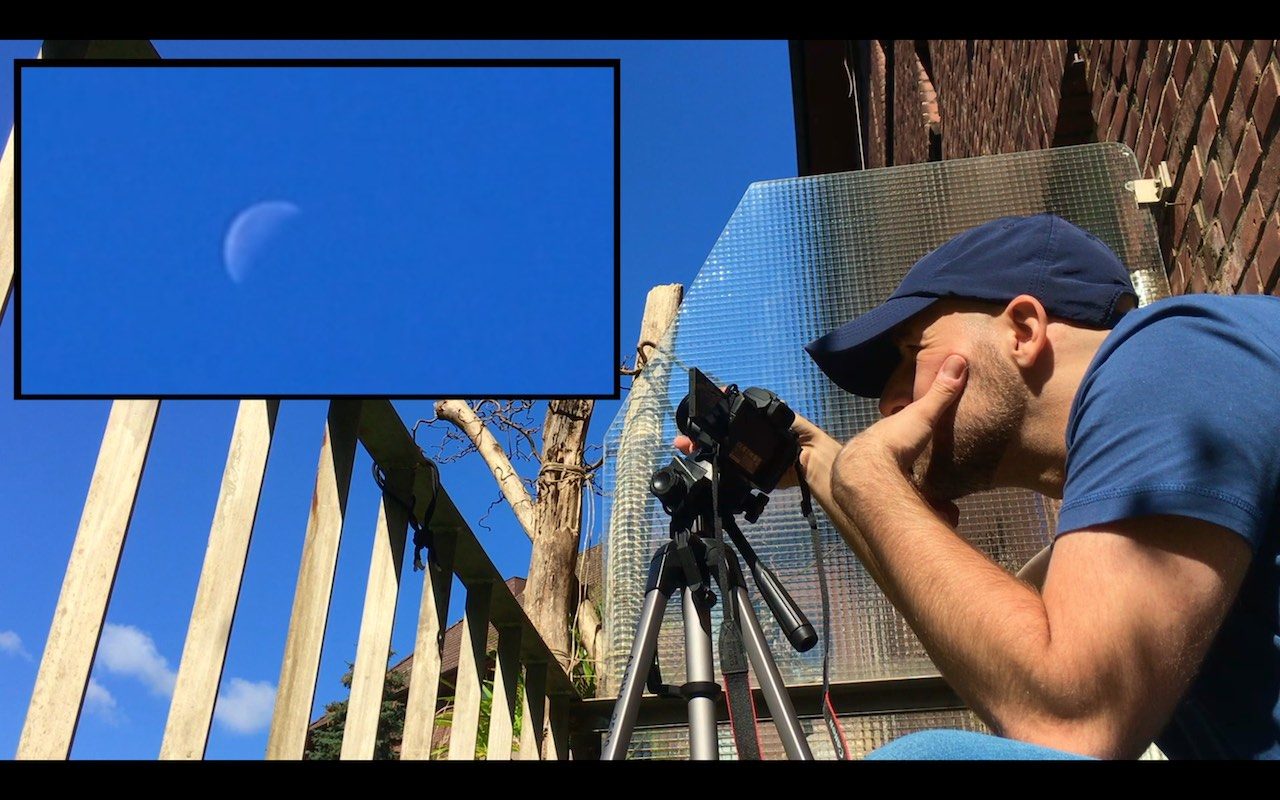
The last day of August and the summer really shows all its sunny power. No ideal conditions for classical astrophotography, I know. BUT: To practise my skills I decided to capture the „Blue Moon“ only with my DSLR (Fig. 1).
Towards new moon and with only 37% illumination you have a quite low contrast. So thats not an easy task. But it was okay for some stacking tests I did. (31.08/2021)
Results
Due to the conditions (37% moon illuminated and daytime – low contrast) and perhaps focussing (hard to see on a sunny day – could have used a cardboard) it was not the day to make a great picture of the moon. BUT: I learned something about image stacking. (I am currently using Lynkeos® because I am working with a Mac at the moment.)
Since I made a movie of the moon I had a lot of single images from my 5-7 min capture.
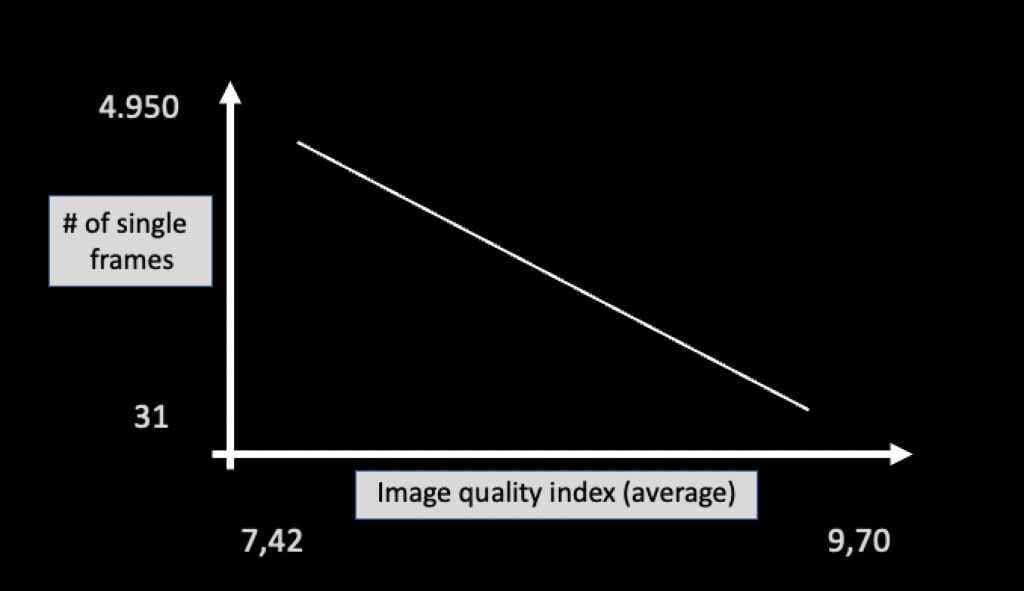
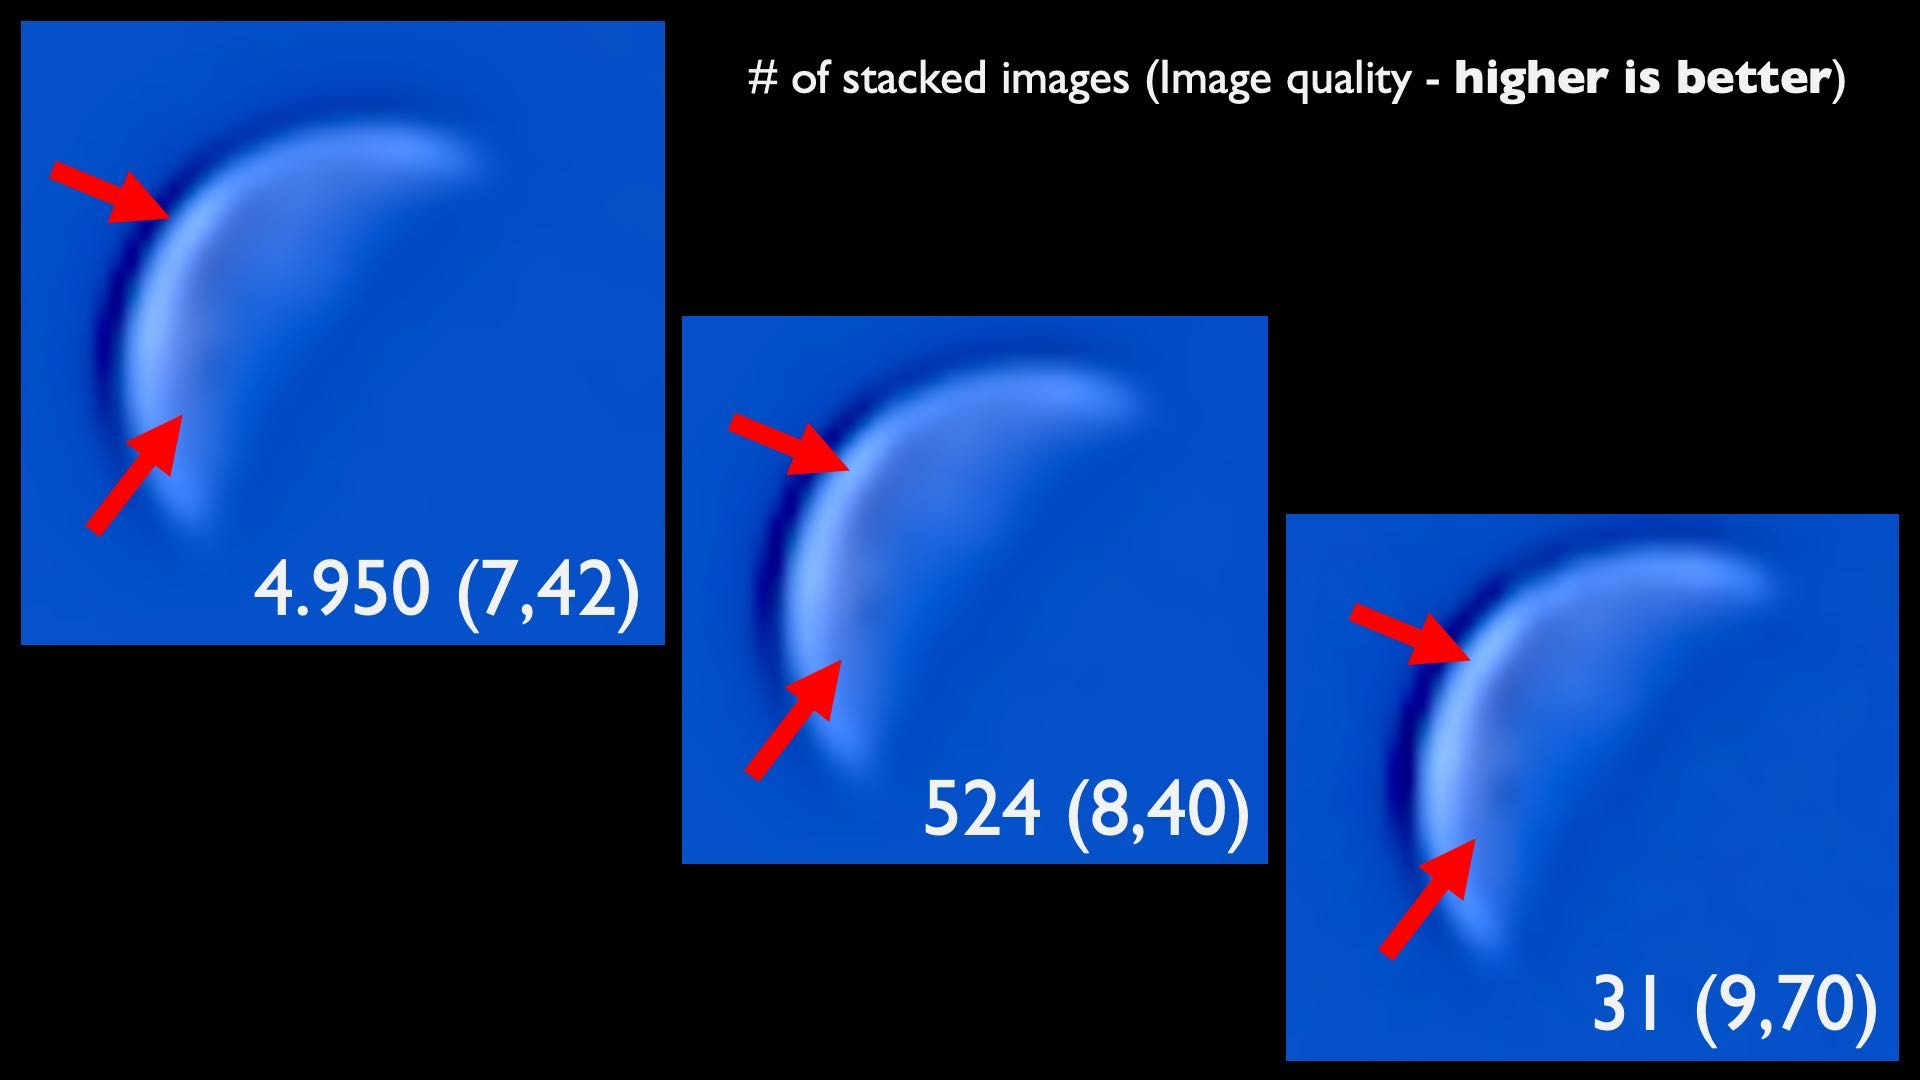
I stacked 4.950, 524 and 31 single images respectively with increasing average image quality (Fig.2 -(quality) & Fig.3).
31 single frames from the movie were sufficient to reach an even better/ higher total stacked image quality than stacking single frames with hundreds or even thousands of single frames.
Location: City (Hamburg, Germany), Backyard, Bortle Scale 6-7 (see educational site)
Weather: 19/66 (°C/F), 55% rel. humidity
Moon phase: 37% illuminated (toward new moon)
Instrument: Canon EOS M50, 15-45mm kit lens
Filter: None
Camera Settings: 5min video (.mp4 file)
